In 1893, Roanoke, Virginia had just come out of a bitter election where prohibition was the highly contested issue. The “wets” won the election by a very slim margin, with only about 51% of the votes. Since this group was composed primarily of African American voters from the third ward of the city, whites’ “intolerance for African Americans reached their zeniths in Roanoke, creating an atmosphere so poisoned with suspicion and disgust that any spark might ignite class warfare” (Dotson 132). Ultimately, this spark ended up being lit by the situation with Sallie A. Bishop and Thomas Smith. To better understand the nature of the riot in 1893, here are some graphs which show what Roanoke looked like back then. Explore the maps and graphs below to determine what may have contributed to the Roanoke race riot of 1893. See if you can find where the third ward of the city may have been…
Lynchings in Virginia
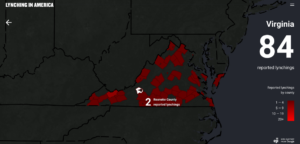
The Equal Justice Initiative put together an interactive map that shows all of the recorded U.S. lynchings in their respective states. The above screenshot depicts the two that occurred in Roanoke- the lynching of William Lavender in 1892 and the lynching of Thomas Smith in 1893, both of which occurred as a result of allegations suggesting that these African Americans supposedly assaulted white women. Click on the above image to explore racial lynchings throughout Virginia and the United States. Notice this other interactive map which depicts the lynching acts of white supremacy: http://www.monroeworktoday.org/explore/map2/index.html
US Census Data
1890 Census:
2017 Census:
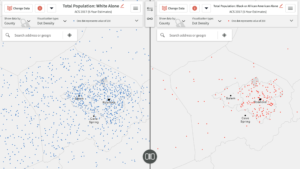
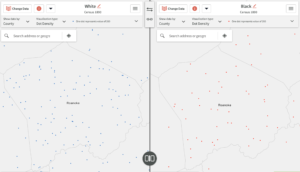
Roanoke was known as the “magic city” because of how quickly it was growing and expanding in the 1890s. This rapid development put Roanoke on the map as the fourth-fastest growing city in the country. Many workers came in search of jobs with the railroad or machine companies in the area. Census data for Roanoke County from 1890 demonstrates the distribution of white versus African American residents. Notice how, in the intervening 125 years, African Americans have increasingly moved towards the center of the city, clustering to the point that as recently as 2017, almost none live on the outskirts of the city.
Racial Populations in Roanoke, Virginia – 1890
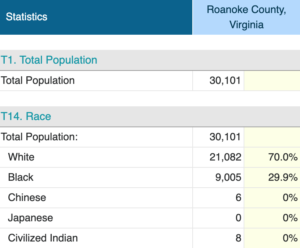
This graph shows the percentages of different races in Roanoke County during the year 1890. As you can see, the white population outnumbered the African Americans nearly 3 to 1. In the case of the Roanoke race riots, these demographics tell us that about 15% of the total population were onlookers during the pyre of Smith’s body, where around 4,000 people were present. “Lynch festivals” like this took place all throughout the South during this time period. When they occurred in Roanoke specifically, the fact that the population was predominantly white enabled a riot to break out from the majority group.
“Lynching” Ngram
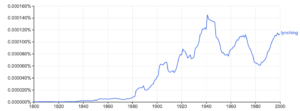
The above Google Ngram is a visual representation of the frequency of the word “lynching” between 1800 and 2000 in all the books on Google books. Notice how beginning around 1880 and 1890, there is a spike in the frequency of this word. This demonstrates how it was right around our time period of focus, 1893, when lynchings were becoming more common throughout the south. In fact, between 1882 and 1968, 3,446 African Americans were lynched in the United States. The two lynchings that occurred in Roanoke, Virginia took place right during the peak in the 1890’s. “Lynching” has been used even more frequently as this practice has been brought to the light in recent years.
As can be seen from these graphs, the demographic data of Roanoke during the 1890s played a significant role in the race riot of 1893. By looking at simple data such as population densities, geographical comparisons, etc., it remains evident that there are a lot of factors that go into an event like this one. Be sure to check out the other tabs on the site so you can see how this event was pictured in newspapers at the time (Documents) as well as the general chronology of the riot itself (StoryMap).
Bibliography
Dotson, Rand. Roanoke, Virginia, 1882-1912: Magic City of the New South. Knoxville: The University of Tennessee Press, 2007.
Equal Justice Initiative. “Lynching in America.” EJI, lynchinginamerica.eji.org/explore/virginia.
Historical Society of Western Virginia. “One Year in Roanoke: 1890.” The Roanoker, November 1, 2011. https://theroanoker.com/interests/history/one-year-in-roanoke-1890/.
NAACP. “History of Lynchings.” NAACP, www.naacp.org/history-of-lynchings/.
“Racial Populations in Roanoke, Virginia – 1890.” Social Explorer, 9 Apr. 2019, www.socialexplorer.com/tables/Census1890/R12112639
Studio, Auut. “MWT – Explore the Map – Lynching Acts of White Supremacy.” Monroe Work Today, www.monroeworktoday.org/explore/map2/index.html.
“White/Black2017.” Social Explorer, 9 Apr. 2019, https://www.socialexplorer.com/523987760a/view.
“White/Black1890.” Social Explorer, 9 Apr. 2019, www.socialexplorer.com/a16f7ee88a/view.