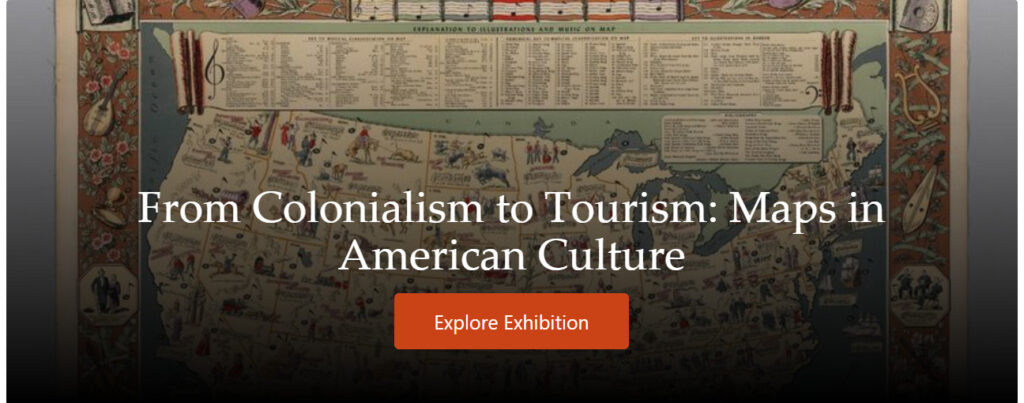
“Folklore Music Map of the United States.” Courtesy the David Rumsey Historical Map Collection.
This digital history project, From Colonialism to Tourism: Maps in American Culture uses an exhibition of maps to explore the impact of maps and how mapping shaped American culture to where it is today. The exhibition will touch on four moments in history: migration along the Oregon Trail, the Civil War, rise of the lumber industry and popularization of automobiles and tourism. This project was created by Greg Bem, Kili Bergau, Emily Felt and Jessica Blanchard for a capstone course at the University of Washington in September 2014. The digital medium for this project is the Digital Public Library of America where the project includes pictures and maps from the different time periods that are discussed. This project has been finished for almost a decade, which is insane to think about. The goal of this project is to show the wide range of the usage of maps and how it changed over time. The intended audience is the public as it is not a private exhibition in which it is free to use.
The argument of this exhibition is that the four moments in American history demonstrate the influence of maps and how Americans imagine, exploit, and interact with geographies and local places. In the exhibition, there are five categories, the four moments in American history and the future. In these categories, there are a few subcategories in each.
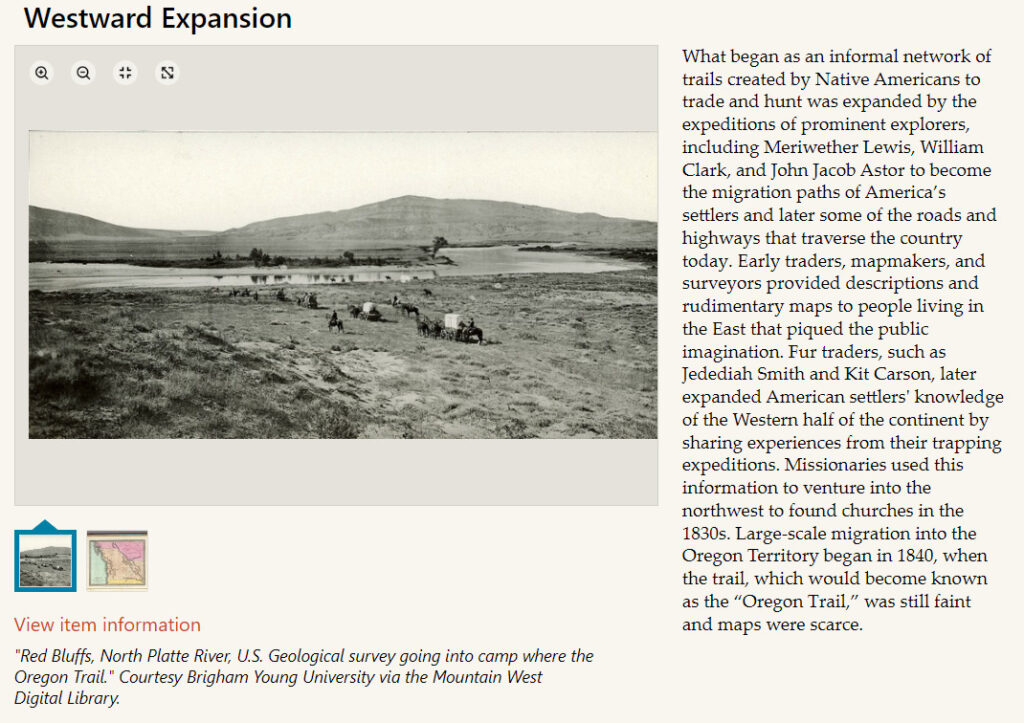
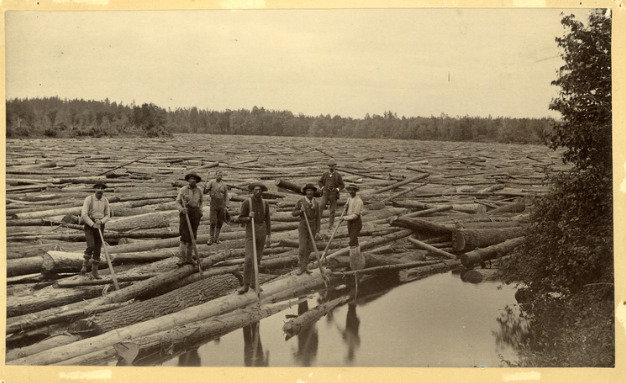
The text that the students included is context of historical events. For example, in the first category, the students explain how Westward Expansion began, early mapmakers and how fur traders expanded the American settlers’ knowledge of the west. The students introduced who John C. Frémont was and the importance of his map-making which would identify the key locations of native tribes and populations along the trail. This would help future pioneers in determining which route works best for them. In the second category, the students introduce the rise and fall of the lumber industry which would increase map making because businessmen and investors wanted to gather natural goods that would make America wealthy after the American Revolution. The multiple paragraphs on the side of the subcategories go over the history of the lumber industry which sparked a ‘Lumberjack culture’ where strongmen worked in the deep forest to keep American wealthy. A few men of that culture can be seen above, with their axes and the thousands of trees that were deforested.
Picture to left: “Lumberjacks and river log drive on St. Louis River, near Duluth, Minnesota.” Courtesy the University of Minnesota Duluth, Kathryn A. Martin Library, Northeast Minnesota Historical Center Collections via the Minnesota Digital Library.
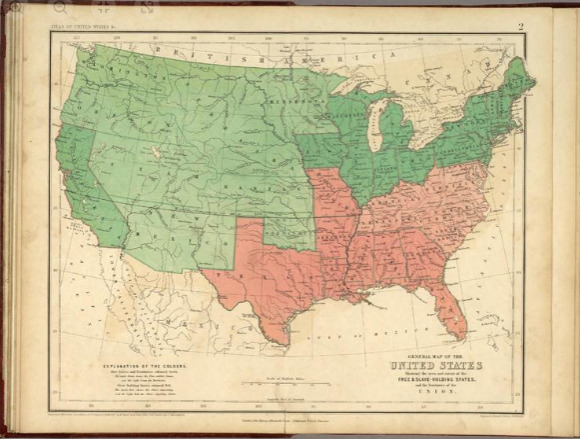
The students of this exhibition claim that maps were used for a variety of purposes for the Civil War. Not only these maps were used in representing the reality of war, but they were also used to define new or lost grounds with the North and South. In the hyperlink, it’ll show the different battles fought in eastern Virginia (https://dp.la/exhibitions/maps-in-american-culture/civil-war-maps?item=801). Maps during the Civil War will also have a purpose as a visual representation of which states were free or slave.
Picture to right: “General Map Of The United States Showing the area and extent of the Free & Slave-Holding States.” Courtesy the David Rumsey Historical Map Collection.
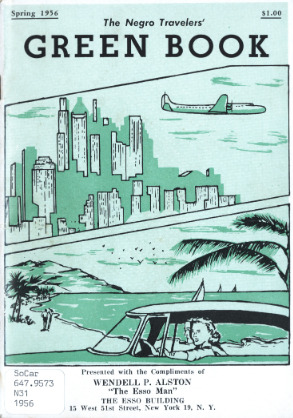
When tourism became increasingly popular in the early twentieth century, maps became more detailed, including gas stations, attractions, road conditions and other key points of interest. The students explained how cartoons would be used for maps to be more appealing and fun. There would also be traveling books that would give tips and tricks to Americans touring the country. The Negro’s Traveling Book gave detailed information and listing for African Americans in the United States on dining and lodging to make them feel comfortable and safe while traveling. (Picture below: Sample pages from “The Negro Travelers’ Green Book.” Courtesy the University of South Carolina South Caroliniana Library via the South Carolina Digital Library.)
As we get closer to the present day, the students described new travel technologies that were released. Airlines were luxurious as you did not need to do the traveling yourself, you pay other to do it for you. Maps today are still used but electronics have taken over physical paper maps. Location sharing systems and Geographic Information Systems are maps that give us point to point directory and are more engaging than the physical map. This history and how maps have impacted us are important to understanding how we got to these advanced systems today.
In terms of criticism, there were many strengths and weaknesses of this exhibition. The text in each category was very informative on how maps were used in these four different time periods but at the same time, I felt as though it was too much. I would have preferred a more simplified quick version of their text to quickly learn the history of maps. It did take more time than I thought to completely read the text for each category. The pictures were fascinating to look at and there were a good two or three for each subcategory which is helpful to visual learners so they can see change over time. Yes, these maps were helpful, but they were not of the best quality. The picture/map would get grainy and difficult to see when zooming in (which is the purpose of the zoom feature, to see the picture/map better). The titles of each category and subcategory were interesting enough to continue reading which was important since it was a bit harder to focus on the multiple paragraphs that were written. I do believe the goal was achieved, but to a minimum.
